Data
87,996 items of data are available, covering 83,313 participants.
Defined-instances run from 2 to 3, labelled using Instancing
2.
Units of measurement are mm.
| Maximum | 3.131 |
| Decile 9 | 2.59 |
| Decile 8 | 2.533 |
| Decile 7 | 2.492 |
| Decile 6 | 2.456 |
| Median | 2.422 |
| Decile 4 | 2.387 |
| Decile 3 | 2.349 |
| Decile 2 | 2.303 |
| Decile 1 | 2.233 |
| Minimum | 1.549 |
|

|
- Mean = 2.41491
- Std.dev = 0.143885
- 147 items below graph minimum of 1.876
- 6 items above graph maximum of 2.947
|
2 Instances
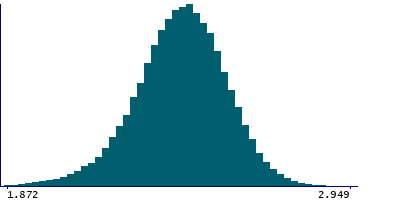
Instance 2 : Imaging visit (2014+)
83,241 participants, 83,241 items
| Maximum | 3.131 |
| Decile 9 | 2.59 |
| Decile 8 | 2.533 |
| Decile 7 | 2.492 |
| Decile 6 | 2.455 |
| Median | 2.421 |
| Decile 4 | 2.386 |
| Decile 3 | 2.348 |
| Decile 2 | 2.302 |
| Decile 1 | 2.231 |
| Minimum | 1.549 |
|
|
- Mean = 2.41406
- Std.dev = 0.144488
- 134 items below graph minimum of 1.872
- 5 items above graph maximum of 2.949
|
Instance 3 : First repeat imaging visit (2019+)
4,755 participants, 4,755 items
| Maximum | 2.993 |
| Decile 9 | 2.594 |
| Decile 8 | 2.537 |
| Decile 7 | 2.5005 |
| Decile 6 | 2.467 |
| Median | 2.434 |
| Decile 4 | 2.399 |
| Decile 3 | 2.365 |
| Decile 2 | 2.324 |
| Decile 1 | 2.261 |
| Minimum | 1.805 |
|

|
- Mean = 2.42971
- Std.dev = 0.132016
- 5 items below graph minimum of 1.928
- 1 item above graph maximum of 2.927
|
Notes
Mean thickness of S-intrapariet+P-trans in the left hemisphere generated by parcellation of the white surface using Destrieux (a2009s) parcellation
0 Related Data-Fields
There are no related data-fields
0 Resources
There are no matching Resources
