Data
9,226 items of data are available, covering 4,613 participants.
Defined-instances run from 2 to 3, labelled using Instancing
2.
Units of measurement are mm.
| Maximum | 3.354 |
| Decile 9 | 2.713 |
| Decile 8 | 2.643 |
| Decile 7 | 2.584 |
| Decile 6 | 2.532 |
| Median | 2.485 |
| Decile 4 | 2.434 |
| Decile 3 | 2.375 |
| Decile 2 | 2.3085 |
| Decile 1 | 2.2185 |
| Minimum | 1.171 |
|

|
- Mean = 2.47378
- Std.dev = 0.191185
- 2 items below graph minimum of 1.724
- 1 item above graph maximum of 3.2075
|
2 Instances
Instance 2 : Imaging visit (2014+)
4,613 participants, 4,613 items
| Maximum | 3.043 |
| Decile 9 | 2.723 |
| Decile 8 | 2.6585 |
| Decile 7 | 2.601 |
| Decile 6 | 2.551 |
| Median | 2.502 |
| Decile 4 | 2.448 |
| Decile 3 | 2.39 |
| Decile 2 | 2.319 |
| Decile 1 | 2.227 |
| Minimum | 1.171 |
|

|
- Mean = 2.48695
- Std.dev = 0.19343
- 1 item below graph minimum of 1.731
|
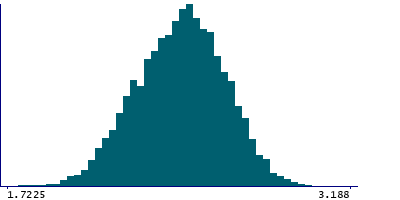
Instance 3 : First repeat imaging visit (2019+)
4,613 participants, 4,613 items
| Maximum | 3.354 |
| Decile 9 | 2.6995 |
| Decile 8 | 2.6225 |
| Decile 7 | 2.567 |
| Decile 6 | 2.515 |
| Median | 2.469 |
| Decile 4 | 2.42 |
| Decile 3 | 2.363 |
| Decile 2 | 2.2975 |
| Decile 1 | 2.211 |
| Minimum | 1.673 |
|
|
- Mean = 2.46061
- Std.dev = 0.187993
- 1 item below graph minimum of 1.7225
- 1 item above graph maximum of 3.188
|
Notes
Mean thickness of the precentral in the left hemisphere generated by parcellation of the white surface using DKT parcellation with the longitudinal processing option in FreeSurfer.
1 Related Data-Field
| Field ID | Description | Relationship |
|---|
| 42902 | Mean thickness of precentral (right ... | Current Field is the left-side counterpart of right-side Field 42902 |
0 Resources
There are no matching Resources