Data
87,996 items of data are available, covering 83,313 participants.
Defined-instances run from 2 to 3, labelled using Instancing
2.
Units of measurement are mm.
| Maximum | 3.396 |
| Decile 9 | 2.709 |
| Decile 8 | 2.627 |
| Decile 7 | 2.567 |
| Decile 6 | 2.517 |
| Median | 2.47 |
| Decile 4 | 2.423 |
| Decile 3 | 2.372 |
| Decile 2 | 2.313 |
| Decile 1 | 2.228 |
| Minimum | 1.201 |
|
|
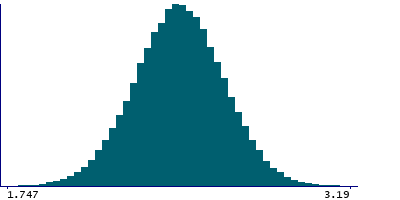
- Mean = 2.46897
- Std.dev = 0.188847
- 20 items below graph minimum of 1.747
- 19 items above graph maximum of 3.19
|
2 Instances
Instance 2 : Imaging visit (2014+)
83,241 participants, 83,241 items
| Maximum | 3.396 |
| Decile 9 | 2.708 |
| Decile 8 | 2.626 |
| Decile 7 | 2.567 |
| Decile 6 | 2.517 |
| Median | 2.469 |
| Decile 4 | 2.423 |
| Decile 3 | 2.372 |
| Decile 2 | 2.312 |
| Decile 1 | 2.227 |
| Minimum | 1.201 |
|

|
- Mean = 2.46841
- Std.dev = 0.189011
- 16 items below graph minimum of 1.746
- 19 items above graph maximum of 3.189
|
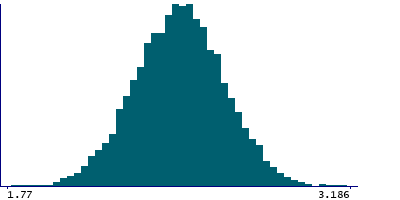
Instance 3 : First repeat imaging visit (2019+)
4,755 participants, 4,755 items
| Maximum | 3.265 |
| Decile 9 | 2.714 |
| Decile 8 | 2.634 |
| Decile 7 | 2.575 |
| Decile 6 | 2.527 |
| Median | 2.48 |
| Decile 4 | 2.435 |
| Decile 3 | 2.381 |
| Decile 2 | 2.323 |
| Decile 1 | 2.242 |
| Minimum | 1.655 |
|
|
- Mean = 2.47867
- Std.dev = 0.1857
- 4 items below graph minimum of 1.77
- 1 item above graph maximum of 3.186
|
Notes
Mean thickness of S-occipital-ant in the left hemisphere generated by parcellation of the white surface using Destrieux (a2009s) parcellation
0 Related Data-Fields
There are no related data-fields
0 Resources
There are no matching Resources