Data
87,996 items of data are available, covering 83,313 participants.
Defined-instances run from 2 to 3, labelled using Instancing
2.
Units of measurement are mm.
| Maximum | 3.347 |
| Decile 9 | 2.834 |
| Decile 8 | 2.768 |
| Decile 7 | 2.72 |
| Decile 6 | 2.679 |
| Median | 2.639 |
| Decile 4 | 2.599 |
| Decile 3 | 2.555 |
| Decile 2 | 2.502 |
| Decile 1 | 2.427 |
| Minimum | 0.934 |
|

|
- Mean = 2.63359
- Std.dev = 0.160598
- 57 items below graph minimum of 2.02
- 3 items above graph maximum of 3.241
|
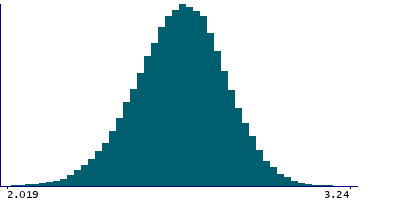
2 Instances
Instance 2 : Imaging visit (2014+)
83,241 participants, 83,241 items
| Maximum | 3.347 |
| Decile 9 | 2.833 |
| Decile 8 | 2.767 |
| Decile 7 | 2.72 |
| Decile 6 | 2.679 |
| Median | 2.639 |
| Decile 4 | 2.598 |
| Decile 3 | 2.555 |
| Decile 2 | 2.501 |
| Decile 1 | 2.426 |
| Minimum | 1.235 |
|
|
- Mean = 2.63309
- Std.dev = 0.160777
- 51 items below graph minimum of 2.019
- 3 items above graph maximum of 3.24
|
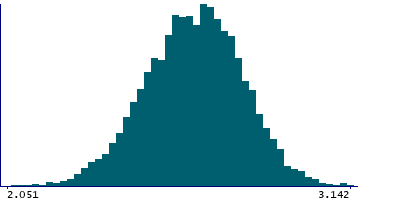
Instance 3 : First repeat imaging visit (2019+)
4,755 participants, 4,755 items
| Maximum | 3.142 |
| Decile 9 | 2.835 |
| Decile 8 | 2.773 |
| Decile 7 | 2.728 |
| Decile 6 | 2.688 |
| Median | 2.648 |
| Decile 4 | 2.607 |
| Decile 3 | 2.565 |
| Decile 2 | 2.513 |
| Decile 1 | 2.443 |
| Minimum | 0.934 |
|
|
- Mean = 2.64237
- Std.dev = 0.157185
- 5 items below graph minimum of 2.051
|
Notes
Mean thickness of G-occipital-middle in the left hemisphere generated by parcellation of the white surface using Destrieux (a2009s) parcellation
0 Related Data-Fields
There are no related data-fields
0 Resources
There are no matching Resources