Data
87,996 items of data are available, covering 83,313 participants.
Defined-instances run from 2 to 3, labelled using Instancing
2.
Units of measurement are mm.
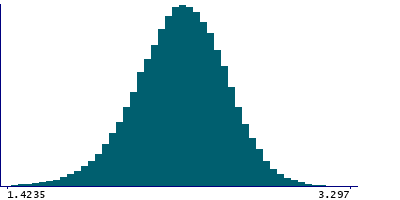
| Maximum | 3.347 |
| Decile 9 | 2.6725 |
| Decile 8 | 2.574 |
| Decile 7 | 2.501 |
| Decile 6 | 2.437 |
| Median | 2.376 |
| Decile 4 | 2.314 |
| Decile 3 | 2.247 |
| Decile 2 | 2.166 |
| Decile 1 | 2.048 |
| Minimum | 0.757 |
|
|
- Mean = 2.36617
- Std.dev = 0.248676
- 98 items below graph minimum of 1.4235
- 2 items above graph maximum of 3.297
|
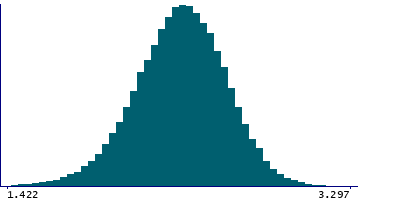
2 Instances
Instance 2 : Imaging visit (2014+)
83,241 participants, 83,241 items
| Maximum | 3.347 |
| Decile 9 | 2.672 |
| Decile 8 | 2.573 |
| Decile 7 | 2.5 |
| Decile 6 | 2.436 |
| Median | 2.374 |
| Decile 4 | 2.313 |
| Decile 3 | 2.246 |
| Decile 2 | 2.164 |
| Decile 1 | 2.047 |
| Minimum | 0.974 |
|
|
- Mean = 2.36493
- Std.dev = 0.248887
- 92 items below graph minimum of 1.422
- 2 items above graph maximum of 3.297
|
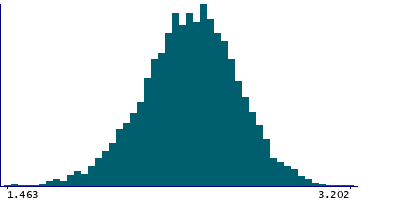
Instance 3 : First repeat imaging visit (2019+)
4,755 participants, 4,755 items
| Maximum | 3.202 |
| Decile 9 | 2.689 |
| Decile 8 | 2.59 |
| Decile 7 | 2.518 |
| Decile 6 | 2.457 |
| Median | 2.396 |
| Decile 4 | 2.334 |
| Decile 3 | 2.272 |
| Decile 2 | 2.192 |
| Decile 1 | 2.076 |
| Minimum | 0.757 |
|
|
- Mean = 2.38781
- Std.dev = 0.24394
- 5 items below graph minimum of 1.463
|
Notes
Mean thickness of BA1 in the right hemisphere generated by parcellation of the white surface using BA_exvivo parcellation
0 Related Data-Fields
There are no related data-fields
0 Resources
There are no matching Resources