Data
87,996 items of data are available, covering 83,313 participants.
Defined-instances run from 2 to 3, labelled using Instancing
2.
Units of measurement are AU.
| Maximum | 35.6362 |
| Decile 9 | 29.0065 |
| Decile 8 | 28.0082 |
| Decile 7 | 27.2915 |
| Decile 6 | 26.6641 |
| Median | 26.0754 |
| Decile 4 | 25.476 |
| Decile 3 | 24.8139 |
| Decile 2 | 24.0223 |
| Decile 1 | 22.9134 |
| Minimum | 7.1924 |
|

|
- Mean = 26.0078
- Std.dev = 2.41007
- 38 items below graph minimum of 16.8204
- 2 items above graph maximum of 35.0996
|
2 Instances
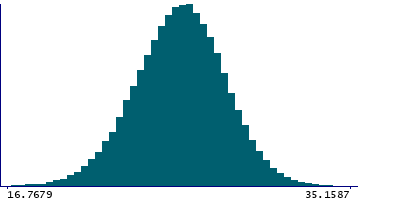
Instance 2 : Imaging visit (2014+)
83,241 participants, 83,241 items
| Maximum | 35.6362 |
| Decile 9 | 29.0284 |
| Decile 8 | 28.0181 |
| Decile 7 | 27.2937 |
| Decile 6 | 26.6618 |
| Median | 26.0673 |
| Decile 4 | 25.4641 |
| Decile 3 | 24.8012 |
| Decile 2 | 24.0072 |
| Decile 1 | 22.8982 |
| Minimum | 7.1924 |
|
|
- Mean = 26.005
- Std.dev = 2.42338
- 34 items below graph minimum of 16.7679
- 2 items above graph maximum of 35.1587
|
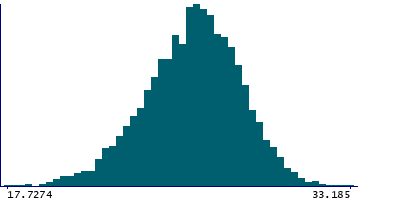
Instance 3 : First repeat imaging visit (2019+)
4,755 participants, 4,755 items
| Maximum | 33.185 |
| Decile 9 | 28.6688 |
| Decile 8 | 27.8777 |
| Decile 7 | 27.2612 |
| Decile 6 | 26.7072 |
| Median | 26.1842 |
| Decile 4 | 25.6796 |
| Decile 3 | 25.0327 |
| Decile 2 | 24.3127 |
| Decile 1 | 23.1981 |
| Minimum | 15.3896 |
|
|
- Mean = 26.057
- Std.dev = 2.16338
- 2 items below graph minimum of 17.7274
|
Notes
Grey-white contrast in caudalmiddlefrontal in the right hemisphere calculated as a percentage of the mean gray-white matter intensity from Desikan-Killiany parcellation
0 Related Data-Fields
There are no related data-fields
0 Resources
There are no matching Resources