Data
87,996 items of data are available, covering 83,313 participants.
Defined-instances run from 2 to 3, labelled using Instancing
2.
Units of measurement are AU.
| Maximum | 35.807 |
| Decile 9 | 29.7169 |
| Decile 8 | 28.9425 |
| Decile 7 | 28.3849 |
| Decile 6 | 27.8914 |
| Median | 27.4199 |
| Decile 4 | 26.9199 |
| Decile 3 | 26.3775 |
| Decile 2 | 25.7079 |
| Decile 1 | 24.7287 |
| Minimum | 15.9181 |
|

|
- Mean = 27.3012
- Std.dev = 1.96916
- 67 items below graph minimum of 19.7405
- 1 item above graph maximum of 34.7051
|
2 Instances
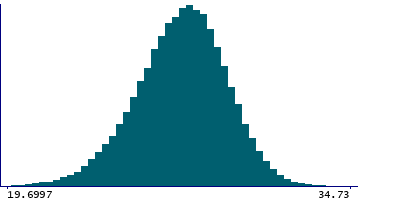
Instance 2 : Imaging visit (2014+)
83,241 participants, 83,241 items
| Maximum | 35.807 |
| Decile 9 | 29.7199 |
| Decile 8 | 28.9424 |
| Decile 7 | 28.3802 |
| Decile 6 | 27.8842 |
| Median | 27.4102 |
| Decile 4 | 26.9057 |
| Decile 3 | 26.3618 |
| Decile 2 | 25.6893 |
| Decile 1 | 24.7098 |
| Minimum | 16.124 |
|
|
- Mean = 27.2926
- Std.dev = 1.97708
- 61 items below graph minimum of 19.6997
- 1 item above graph maximum of 34.73
|
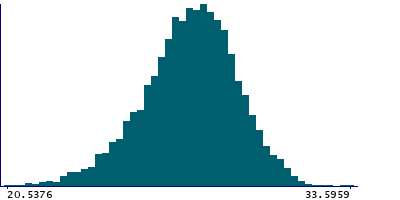
Instance 3 : First repeat imaging visit (2019+)
4,755 participants, 4,755 items
| Maximum | 33.5959 |
| Decile 9 | 29.6495 |
| Decile 8 | 28.946 |
| Decile 7 | 28.4532 |
| Decile 6 | 28.0144 |
| Median | 27.5791 |
| Decile 4 | 27.1242 |
| Decile 3 | 26.6606 |
| Decile 2 | 26.0324 |
| Decile 1 | 25.0936 |
| Minimum | 15.9181 |
|
|
- Mean = 27.4519
- Std.dev = 1.8184
- 6 items below graph minimum of 20.5376
|
Notes
Grey-white contrast in precuneus in the left hemisphere calculated as a percentage of the mean gray-white matter intensity from Desikan-Killiany parcellation
0 Related Data-Fields
There are no related data-fields
0 Resources
There are no matching Resources