Data
87,996 items of data are available, covering 83,313 participants.
Defined-instances run from 2 to 3, labelled using Instancing
2.
Units of measurement are mm2.
| Maximum | 7787 |
| Decile 9 | 5417 |
| Decile 8 | 5154 |
| Decile 7 | 4977 |
| Decile 6 | 4827 |
| Median | 4690 |
| Decile 4 | 4560 |
| Decile 3 | 4428 |
| Decile 2 | 4276 |
| Decile 1 | 4073 |
| Minimum | 1663 |
|

|
- Mean = 4723.09
- Std.dev = 534.848
- 37 items below graph minimum of 2729
- 69 items above graph maximum of 6761
|
2 Instances
Instance 2 : Imaging visit (2014+)
83,241 participants, 83,241 items
| Maximum | 7787 |
| Decile 9 | 5415 |
| Decile 8 | 5152 |
| Decile 7 | 4974 |
| Decile 6 | 4825 |
| Median | 4688 |
| Decile 4 | 4558 |
| Decile 3 | 4426 |
| Decile 2 | 4275 |
| Decile 1 | 4071 |
| Minimum | 1663 |
|

|
- Mean = 4721.09
- Std.dev = 534.634
- 36 items below graph minimum of 2727
- 64 items above graph maximum of 6759
|
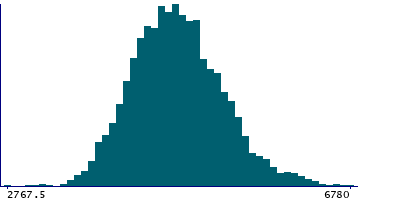
Instance 3 : First repeat imaging visit (2019+)
4,755 participants, 4,755 items
| Maximum | 7247 |
| Decile 9 | 5442.5 |
| Decile 8 | 5196 |
| Decile 7 | 5004.5 |
| Decile 6 | 4864 |
| Median | 4727 |
| Decile 4 | 4595 |
| Decile 3 | 4457 |
| Decile 2 | 4303 |
| Decile 1 | 4105 |
| Minimum | 2731 |
|
|
- Mean = 4758.15
- Std.dev = 537.364
- 2 items below graph minimum of 2767.5
- 4 items above graph maximum of 6780
|
Notes
Area of postcentral in the right hemisphere generated by parcellation of the pial surface using Desikan-Killiany parcellation
0 Related Data-Fields
There are no related data-fields
0 Resources
There are no matching Resources