Data
87,996 items of data are available, covering 83,313 participants.
Defined-instances run from 2 to 3, labelled using Instancing
2.
Units of measurement are mm.
| Maximum | 3.505 |
| Decile 9 | 2.969 |
| Decile 8 | 2.91 |
| Decile 7 | 2.867 |
| Decile 6 | 2.828 |
| Median | 2.791 |
| Decile 4 | 2.752 |
| Decile 3 | 2.709 |
| Decile 2 | 2.656 |
| Decile 1 | 2.574 |
| Minimum | 1.64 |
|

|
- Mean = 2.77951
- Std.dev = 0.157268
- 123 items below graph minimum of 2.179
- 3 items above graph maximum of 3.364
|
2 Instances
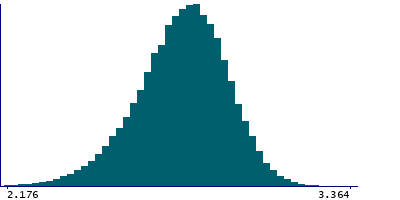
Instance 2 : Imaging visit (2014+)
83,241 participants, 83,241 items
| Maximum | 3.505 |
| Decile 9 | 2.968 |
| Decile 8 | 2.909 |
| Decile 7 | 2.866 |
| Decile 6 | 2.827 |
| Median | 2.79 |
| Decile 4 | 2.751 |
| Decile 3 | 2.707 |
| Decile 2 | 2.654 |
| Decile 1 | 2.572 |
| Minimum | 1.655 |
|
|
- Mean = 2.77837
- Std.dev = 0.157664
- 115 items below graph minimum of 2.176
- 3 items above graph maximum of 3.364
|
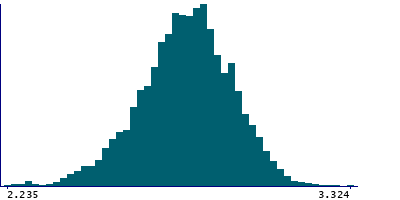
Instance 3 : First repeat imaging visit (2019+)
4,755 participants, 4,755 items
| Maximum | 3.324 |
| Decile 9 | 2.981 |
| Decile 8 | 2.924 |
| Decile 7 | 2.878 |
| Decile 6 | 2.842 |
| Median | 2.807 |
| Decile 4 | 2.771 |
| Decile 3 | 2.732 |
| Decile 2 | 2.682 |
| Decile 1 | 2.608 |
| Minimum | 1.64 |
|
|
- Mean = 2.79948
- Std.dev = 0.148759
- 7 items below graph minimum of 2.235
|
Notes
Mean thickness of supramarginal in the right hemisphere generated by parcellation of the white surface using Desikan-Killiany parcellation
0 Related Data-Fields
There are no related data-fields
0 Resources
There are no matching Resources