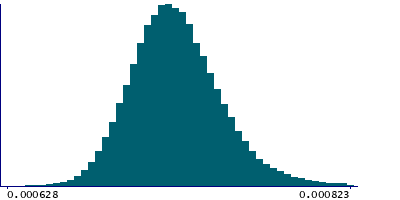
Data
83,911 items of data are available, covering 79,384 participants.
Defined-instances run from 2 to 3, labelled using Instancing
2.
Units of measurement are AU.
| Maximum | 0.002087 |
| Decile 9 | 0.000758 |
| Decile 8 | 0.000745 |
| Decile 7 | 0.000736 |
| Decile 6 | 0.000729 |
| Median | 0.000722 |
| Decile 4 | 0.000716 |
| Decile 3 | 0.00071 |
| Decile 2 | 0.000703 |
| Decile 1 | 0.000693 |
| Minimum | 0 |
|
|
- Mean = 0.000725102
- Std.dev = 3.04403e-05
- 19 items below graph minimum of 0.000628
- 689 items above graph maximum of 0.000823
|
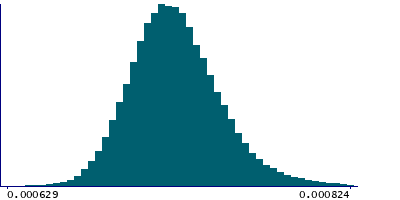
2 Instances
Instance 2 : Imaging visit (2014+)
79,153 participants, 79,153 items
| Maximum | 0.002087 |
| Decile 9 | 0.000759 |
| Decile 8 | 0.000745 |
| Decile 7 | 0.000736 |
| Decile 6 | 0.000729 |
| Median | 0.000723 |
| Decile 4 | 0.000717 |
| Decile 3 | 0.000711 |
| Decile 2 | 0.000703 |
| Decile 1 | 0.000694 |
| Minimum | 0 |
|
|
- Mean = 0.000725659
- Std.dev = 3.04969e-05
- 19 items below graph minimum of 0.000629
- 644 items above graph maximum of 0.000824
|
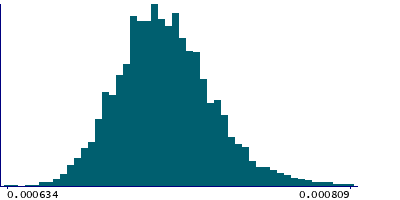
Instance 3 : First repeat imaging visit (2019+)
4,758 participants, 4,758 items
| Maximum | 0.000976 |
| Decile 9 | 0.000747 |
| Decile 8 | 0.000734 |
| Decile 7 | 0.000726 |
| Decile 6 | 0.00072 |
| Median | 0.000713 |
| Decile 4 | 0.000707 |
| Decile 3 | 0.000701 |
| Decile 2 | 0.000695 |
| Decile 1 | 0.000685 |
| Minimum | 0.000634 |
|
|
- Mean = 0.000715835
- Std.dev = 2.78967e-05
- 40 items above graph maximum of 0.000809
|
Notes
Mean MD (mean diffusivity) in inferior cerebellar peduncle (right) on FA (fractional anisotropy) skeleton (from dMRI data)
0 Related Data-Fields
There are no related data-fields
2 Applications
| Application ID | Title |
|---|
| 17689 | Genetic, environmental and lifestyle predictors of brain/cognitive-related outcomes. |
| 22783 | The joint analysis of imaging data and genetic data for early tumor detection, prevention, diagnosis and treatment |