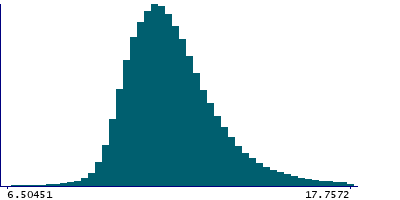
Data
503,466 items of data are available, covering 484,319 participants.
Defined-instances run from 0 to 1, labelled using Instancing
2.
Units of measurement are percent.
| Maximum | 36.9387 |
| Decile 9 | 14.0063 |
| Decile 8 | 13.067 |
| Decile 7 | 12.5088 |
| Decile 6 | 12.09 |
| Median | 11.73 |
| Decile 4 | 11.3976 |
| Decile 3 | 11.066 |
| Decile 2 | 10.704 |
| Decile 1 | 10.2554 |
| Minimum | 0.0400196 |
|
|
- Mean = 11.99
- Std.dev = 1.8041
- 1792 items below graph minimum of 6.50451
- 6016 items above graph maximum of 17.7572
|
2 Instances
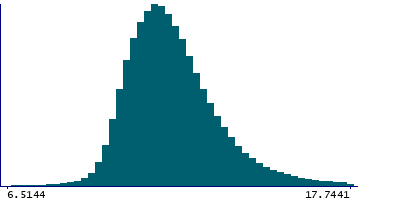
Instance 0 : Initial assessment visit (2006-2010) at which participants were recruited and consent given
483,759 participants, 483,759 items
| Maximum | 36.9387 |
| Decile 9 | 14.0009 |
| Decile 8 | 13.065 |
| Decile 7 | 12.507 |
| Decile 6 | 12.0892 |
| Median | 11.7299 |
| Decile 4 | 11.398 |
| Decile 3 | 11.067 |
| Decile 2 | 10.7058 |
| Decile 1 | 10.2576 |
| Minimum | 0.0400196 |
|
|
- Mean = 11.9893
- Std.dev = 1.80238
- 1733 items below graph minimum of 6.5144
- 5793 items above graph maximum of 17.7441
|
Instance 1 : First repeat assessment visit (2012-13)
19,707 participants, 19,707 items
| Maximum | 32.0781 |
| Decile 9 | 14.1405 |
| Decile 8 | 13.1365 |
| Decile 7 | 12.5455 |
| Decile 6 | 12.1065 |
| Median | 11.733 |
| Decile 4 | 11.3909 |
| Decile 3 | 11.044 |
| Decile 2 | 10.672 |
| Decile 1 | 10.212 |
| Minimum | 1.6646 |
|

|
- Mean = 12.0063
- Std.dev = 1.84573
- 64 items below graph minimum of 6.2835
- 215 items above graph maximum of 18.069
|