Data
507,960 items of data are available, covering 488,512 participants.
Defined-instances run from 0 to 1, labelled using Instancing
2.
Units of measurement are mmol/l.
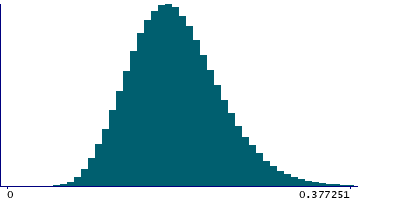
| Maximum | 0.660118 |
| Decile 9 | 0.250591 |
| Decile 8 | 0.2253 |
| Decile 7 | 0.20798 |
| Decile 6 | 0.19394 |
| Median | 0.18129 |
| Decile 4 | 0.168986 |
| Decile 3 | 0.156388 |
| Decile 2 | 0.142326 |
| Decile 1 | 0.12393 |
| Minimum | 0.0301489 |
|
|
- Mean = 0.185068
- Std.dev = 0.0500687
- 694 items above graph maximum of 0.377251
|
2 Instances
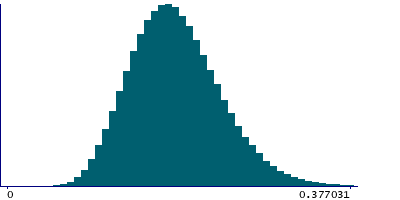
Instance 0 : Initial assessment visit (2006-2010) at which participants were recruited and consent given
488,083 participants, 488,083 items
| Maximum | 0.660118 |
| Decile 9 | 0.25057 |
| Decile 8 | 0.225284 |
| Decile 7 | 0.20797 |
| Decile 6 | 0.19394 |
| Median | 0.18132 |
| Decile 4 | 0.16904 |
| Decile 3 | 0.15647 |
| Decile 2 | 0.142431 |
| Decile 1 | 0.124109 |
| Minimum | 0.0301489 |
|
|
- Mean = 0.185123
- Std.dev = 0.0500208
- 674 items above graph maximum of 0.377031
|
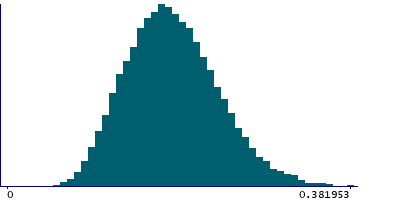
Instance 1 : First repeat assessment visit (2012-13)
19,877 participants, 19,877 items
| Maximum | 0.521973 |
| Decile 9 | 0.251017 |
| Decile 8 | 0.22574 |
| Decile 7 | 0.208203 |
| Decile 6 | 0.193995 |
| Median | 0.18043 |
| Decile 4 | 0.167555 |
| Decile 3 | 0.15422 |
| Decile 2 | 0.139175 |
| Decile 1 | 0.12008 |
| Minimum | 0.036013 |
|
|
- Mean = 0.183726
- Std.dev = 0.0512145
- 18 items above graph maximum of 0.381953
|