Data
78,765 items of data are available, covering 72,674 participants.
Defined-instances run from 2 to 3, labelled using Instancing
2.
Units of measurement are cm2.
| Maximum | 1170.63 |
| Decile 9 | 243.955 |
| Decile 8 | 235.874 |
| Decile 7 | 230.094 |
| Decile 6 | 225.297 |
| Median | 220.9 |
| Decile 4 | 216.602 |
| Decile 3 | 212.044 |
| Decile 2 | 206.968 |
| Decile 1 | 200.233 |
| Minimum | 0 |
|
|
- Mean = 221.581
- Std.dev = 18.013
- 9 items below graph minimum of 156.511
- 28 items above graph maximum of 287.677
|
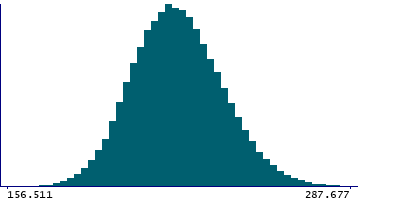
2 Instances
Instance 2 : Imaging visit (2014+)
72,404 participants, 72,404 items
| Maximum | 1170.63 |
| Decile 9 | 243.927 |
| Decile 8 | 235.857 |
| Decile 7 | 230.048 |
| Decile 6 | 225.251 |
| Median | 220.833 |
| Decile 4 | 216.533 |
| Decile 3 | 211.993 |
| Decile 2 | 206.932 |
| Decile 1 | 200.214 |
| Minimum | 0 |
|

|
- Mean = 221.55
- Std.dev = 18.0828
- 8 items below graph minimum of 156.501
- 25 items above graph maximum of 287.64
|
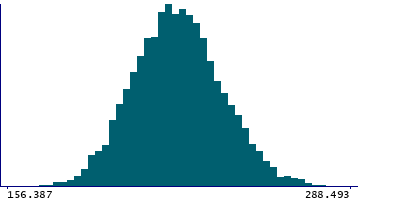
Instance 3 : First repeat imaging visit (2019+)
6,361 participants, 6,361 items
| Maximum | 293.729 |
| Decile 9 | 244.457 |
| Decile 8 | 236.032 |
| Decile 7 | 230.492 |
| Decile 6 | 225.901 |
| Median | 221.506 |
| Decile 4 | 217.259 |
| Decile 3 | 212.761 |
| Decile 2 | 207.525 |
| Decile 1 | 200.422 |
| Minimum | 0 |
|
|
- Mean = 221.936
- Std.dev = 17.1948
- 1 item below graph minimum of 156.387
- 2 items above graph maximum of 288.493
|