Data
74,616 items of data are available, covering 69,208 participants.
Defined-instances run from 2 to 3, labelled using Instancing
2.
Units of measurement are g/cm2.
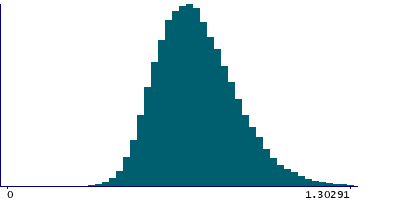
| Maximum | 1.98032 |
| Decile 9 | 0.921486 |
| Decile 8 | 0.842161 |
| Decile 7 | 0.789064 |
| Decile 6 | 0.744798 |
| Median | 0.706645 |
| Decile 4 | 0.669611 |
| Decile 3 | 0.631817 |
| Decile 2 | 0.591516 |
| Decile 1 | 0.540067 |
| Minimum | 0 |
|
|
- Mean = 0.721034
- Std.dev = 0.151898
- 117 items above graph maximum of 1.30291
|
2 Instances
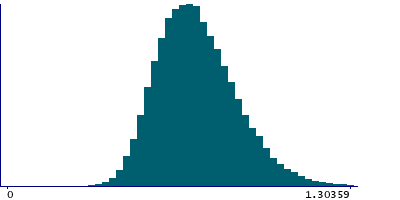
Instance 2 : Imaging visit (2014+)
68,859 participants, 68,859 items
| Maximum | 1.98032 |
| Decile 9 | 0.921691 |
| Decile 8 | 0.842161 |
| Decile 7 | 0.788812 |
| Decile 6 | 0.744517 |
| Median | 0.706418 |
| Decile 4 | 0.669221 |
| Decile 3 | 0.631392 |
| Decile 2 | 0.591227 |
| Decile 1 | 0.53979 |
| Minimum | 0 |
|
|
- Mean = 0.720806
- Std.dev = 0.152072
- 106 items above graph maximum of 1.30359
|
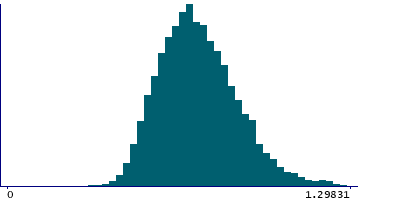
Instance 3 : First repeat imaging visit (2019+)
5,757 participants, 5,757 items
| Maximum | 1.40934 |
| Decile 9 | 0.920624 |
| Decile 8 | 0.842242 |
| Decile 7 | 0.791253 |
| Decile 6 | 0.748107 |
| Median | 0.70905 |
| Decile 4 | 0.674367 |
| Decile 3 | 0.636625 |
| Decile 2 | 0.595048 |
| Decile 1 | 0.542935 |
| Minimum | 0.301346 |
|
|
- Mean = 0.72376
- Std.dev = 0.149773
- 11 items above graph maximum of 1.29831
|