Data
115,979 items of data are available, covering 97,343 participants.
Some values have special meanings defined by Data-Coding
909.
Defined-instances run from 2 to 4, labelled using Instancing
2.
Units of measurement are micrometres.
| Maximum | 1732 |
| Decile 9 | 770 |
| Decile 8 | 693 |
| Decile 7 | 654 |
| Decile 6 | 616 |
| Median | 577 |
| Decile 4 | 539 |
| Decile 3 | 500 |
| Decile 2 | 500 |
| Decile 1 | 450 |
| Minimum | 10 |
|
|
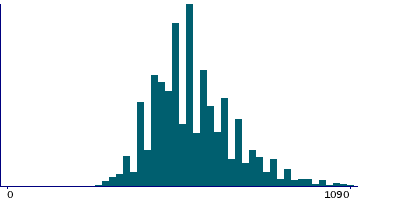
- Mean = 594.172
- Std.dev = 137.64
- 492 items above graph maximum of 1090
- 192 items have value 0 (Measure invalid)
|
2 Instances
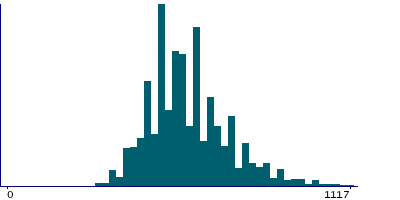
Instance 2 : Imaging visit (2014+)
96,385 participants, 96,205 items
| Maximum | 1732 |
| Decile 9 | 770 |
| Decile 8 | 693 |
| Decile 7 | 654 |
| Decile 6 | 616 |
| Median | 577 |
| Decile 4 | 539 |
| Decile 3 | 500 |
| Decile 2 | 500 |
| Decile 1 | 423 |
| Minimum | 10 |
|
|
- Mean = 592.192
- Std.dev = 136.588
- 277 items above graph maximum of 1117
- 180 items have value 0 (Measure invalid)
|
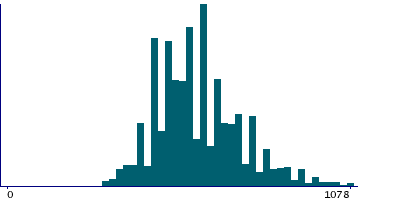
Instance 3 : First repeat imaging visit (2019+)
19,566 participants, 19,554 items
| Maximum | 1732 |
| Decile 9 | 770 |
| Decile 8 | 693 |
| Decile 7 | 654 |
| Decile 6 | 616 |
| Median | 577 |
| Decile 4 | 539 |
| Decile 3 | 539 |
| Decile 2 | 500 |
| Decile 1 | 462 |
| Minimum | 30 |
|
|
- Mean = 603.921
- Std.dev = 142.293
- 121 items above graph maximum of 1078
- 12 items have value 0 (Measure invalid)
|