Data
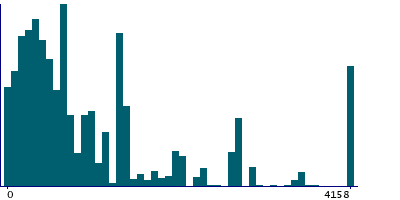
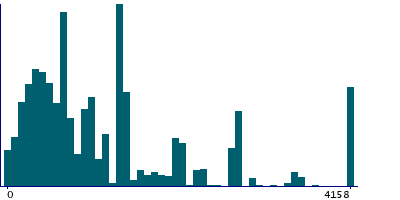
466,632 items of data are available, covering 394,110 participants.
Defined-instances run from 0 to 3, labelled using Instancing
2.
Units of measurement are minutes/week.
| Maximum | 4158 |
| Decile 9 | 2772 |
| Decile 8 | 1386 |
| Decile 7 | 1188 |
| Decile 6 | 891 |
| Median | 693 |
| Decile 4 | 495 |
| Decile 3 | 396 |
| Decile 2 | 247.5 |
| Decile 1 | 132 |
| Minimum | 0 |
|
|
- Mean = 1041.75
- Std.dev = 1065.7
|
4 Instances
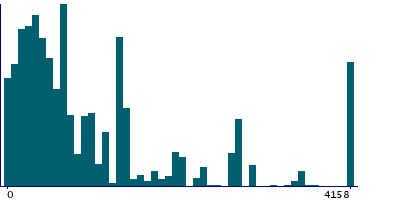
Instance 0 : Initial assessment visit (2006-2010) at which participants were recruited and consent given
384,836 participants, 384,836 items
| Maximum | 4158 |
| Decile 9 | 2772 |
| Decile 8 | 1386 |
| Decile 7 | 1188 |
| Decile 6 | 792 |
| Median | 693 |
| Decile 4 | 462 |
| Decile 3 | 346.5 |
| Decile 2 | 247.5 |
| Decile 1 | 132 |
| Minimum | 0 |
|
|
- Mean = 1032.45
- Std.dev = 1074.81
|
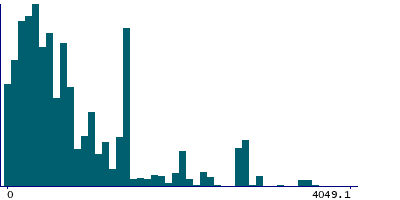
Instance 1 : First repeat assessment visit (2012-13)
17,287 participants, 17,287 items
| Maximum | 4158 |
| Decile 9 | 2079 |
| Decile 8 | 1386 |
| Decile 7 | 990 |
| Decile 6 | 693 |
| Median | 594 |
| Decile 4 | 462 |
| Decile 3 | 330 |
| Decile 2 | 198 |
| Decile 1 | 108.9 |
| Minimum | 0 |
|
|
- Mean = 893.709
- Std.dev = 944.629
- 598 items above graph maximum of 4049.1
|
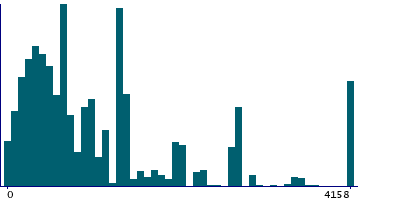
Instance 2 : Imaging visit (2014+)
59,243 participants, 59,243 items
| Maximum | 4158 |
| Decile 9 | 2772 |
| Decile 8 | 1617 |
| Decile 7 | 1386 |
| Decile 6 | 1039.5 |
| Median | 693 |
| Decile 4 | 660 |
| Decile 3 | 462 |
| Decile 2 | 330 |
| Decile 1 | 198 |
| Minimum | 0 |
|
|
- Mean = 1131.63
- Std.dev = 1033.75
|
Instance 3 : First repeat imaging visit (2019+)
5,266 participants, 5,266 items
| Maximum | 4158 |
| Decile 9 | 2772 |
| Decile 8 | 1848 |
| Decile 7 | 1386 |
| Decile 6 | 1155 |
| Median | 907.5 |
| Decile 4 | 693 |
| Decile 3 | 495 |
| Decile 2 | 396 |
| Decile 1 | 231 |
| Minimum | 0 |
|
|
- Mean = 1196.75
- Std.dev = 1035.21
|