Data
71,730 items of data are available, covering 67,287 participants.
Defined-instances run from 2 to 3, labelled using Instancing
2.
Units of measurement are g.
| Maximum | 1841 |
| Decile 9 | 1046 |
| Decile 8 | 939 |
| Decile 7 | 862 |
| Decile 6 | 795 |
| Median | 734 |
| Decile 4 | 676 |
| Decile 3 | 623 |
| Decile 2 | 570 |
| Decile 1 | 509 |
| Minimum | 0 |
|
|
- There are 1265 distinct values.
- Mean = 758.784
- Std.dev = 208.284
- 31 items above graph maximum of 1583
|
2 Instances
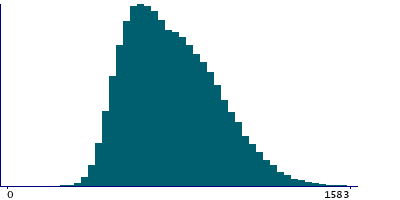
Instance 2 : Imaging visit (2014+)
65,369 participants, 65,369 items
| Maximum | 1841 |
| Decile 9 | 1046 |
| Decile 8 | 939 |
| Decile 7 | 862 |
| Decile 6 | 795 |
| Median | 733 |
| Decile 4 | 676 |
| Decile 3 | 622 |
| Decile 2 | 570 |
| Decile 1 | 509 |
| Minimum | 0 |
|

|
- There are 1252 distinct values.
- Mean = 758.643
- Std.dev = 208.515
- 26 items above graph maximum of 1583
|
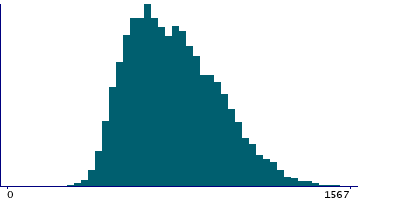
Instance 3 : First repeat imaging visit (2019+)
6,361 participants, 6,361 items
| Maximum | 1741 |
| Decile 9 | 1040 |
| Decile 8 | 939.5 |
| Decile 7 | 860.5 |
| Decile 6 | 795 |
| Median | 738 |
| Decile 4 | 680 |
| Decile 3 | 628 |
| Decile 2 | 574 |
| Decile 1 | 513 |
| Minimum | 0 |
|
|
- There are 940 distinct values.
- Mean = 760.234
- Std.dev = 205.896
- 6 items above graph maximum of 1567
|
Notes
Value output by DXA system
0 Related Data-Fields
There are no related data-fields
0 Resources
There are no matching Resources