Data
537,216 items of data are available, covering 497,300 participants.
Defined-instances run from 0 to 2, labelled using Instancing
2.
Units of measurement are mg/L.
| Maximum | 477 |
| Decile 9 | 299 |
| Decile 8 | 274 |
| Decile 7 | 250 |
| Decile 6 | 126 |
| Median | 81 |
| Decile 4 | 65 |
| Decile 3 | 50 |
| Decile 2 | 38 |
| Decile 1 | 26 |
| Minimum | 1 |
|
|
- There are 350 distinct values.
- Mean = 141.087
- Std.dev = 114.176
|
3 Instances
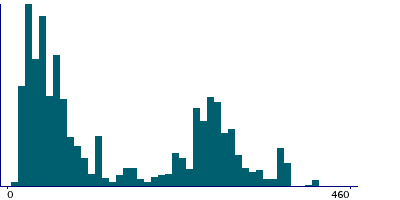
Instance 0 : Initial assessment visit (2006-2010) at which participants were recruited and consent given
496,970 participants, 496,970 items
| Maximum | 460 |
| Decile 9 | 300 |
| Decile 8 | 276 |
| Decile 7 | 254 |
| Decile 6 | 160 |
| Median | 84 |
| Decile 4 | 66 |
| Decile 3 | 50 |
| Decile 2 | 39 |
| Decile 1 | 27 |
| Minimum | 5 |
|
|
- There are 306 distinct values.
- Mean = 145.527
- Std.dev = 115.035
|
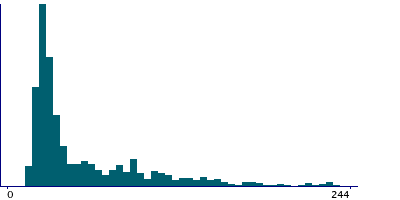
Instance 1 : First repeat assessment visit (2012-13)
20,303 participants, 20,303 items
| Maximum | 358 |
| Decile 9 | 133 |
| Decile 8 | 90 |
| Decile 7 | 65 |
| Decile 6 | 43 |
| Median | 33 |
| Decile 4 | 29 |
| Decile 3 | 27 |
| Decile 2 | 24 |
| Decile 1 | 22 |
| Minimum | 1 |
|
|
- There are 199 distinct values.
- Mean = 60.6996
- Std.dev = 57.2373
- 631 items above graph maximum of 244
|
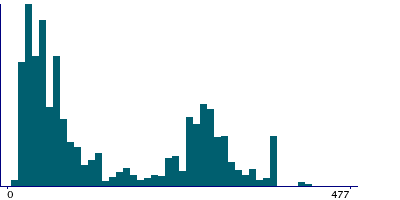
Instance 2 : Imaging visit (2014+)
19,943 participants, 19,943 items
| Maximum | 477 |
| Decile 9 | 282 |
| Decile 8 | 211 |
| Decile 7 | 133 |
| Decile 6 | 86 |
| Median | 65 |
| Decile 4 | 56 |
| Decile 3 | 40 |
| Decile 2 | 28 |
| Decile 1 | 21 |
| Minimum | 1 |
|

|
- There are 250 distinct values.
- Mean = 112.277
- Std.dev = 100.811
|
Notes
Domestic water calcium carbonate concentration.
1 Related Data-Field
| Field ID | Description | Relationship |
|---|
| 21102 | Year of survey | Current Field measures are related to a survey year captured in Field 21102 |
0 Resources
There are no matching Resources